Infografía / Edu Visual — generador de infografía científica ficticia
Más Infografías
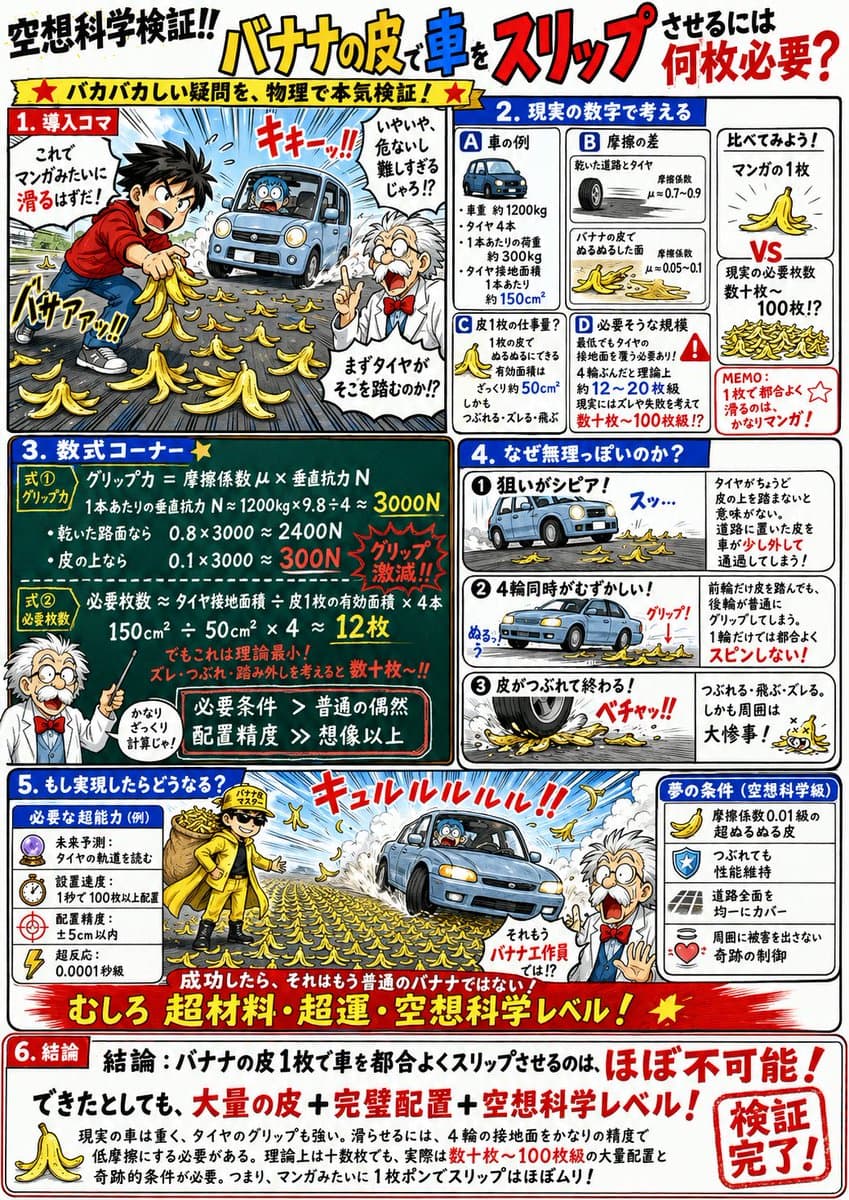
Arquitectura de sistema LLM multi-agente
Landscape 16:9 high-fidelity systems figure of a multi-agent LLM architecture, in the style of a richly detailed AutoGen / LangGraph / Anthropic Managed Agents Figure 1. Subtle drop-shadows, warm-copper highlights, numbered flow markers ①②③④. ZONE 1 — "User interface": rounded user box with placeholder task "research question: summarize recent red-teaming attacks and reproduce the top three". ZONE 2 — "Orchestrator layer": central hexagonal hub "Planner LLM" with warm-copper top edge. Three satellite chips: "Task decomposition", "Agent routing", "Re-plan on failure". Small inset chip "prompt cache hit ~98%". ZONE 3 — "Specialised workers": 2×2 hexagons "Researcher" / "Coder" / "Critic" / "Writer", each with glyph + status ribbon ("idle", "running step 3/5", "done", "running step 2/4"). Centre labeled "async message bus". ZONE 4 — "Tools & memory": (a) "Tool registry" panel listing "web_search ×41", "python_exec ×27", "read_file ×18", "write_file ×12", "browser_use ×7"; (b) "Memory" panel with "Short-term scratchpad" and cylinder "Long-term vector store — 1.8M episodes". Bottom inset "Example trace": 8-step horizontal timeline chips from "User asks" through "Planner decomposes", "Researcher: web_search(...)", "Coder: python_exec(...)", "Critic: verify", "Re-plan" (loop-back arrow), "Writer: compose final answer". Title: "Agentic LLM system: planner orchestrates specialised workers over a shared tool and memory layer". Subtitle: "adapted from AutoGen (Wu et al., 2023), LangGraph, and Anthropic Managed Agents patterns".
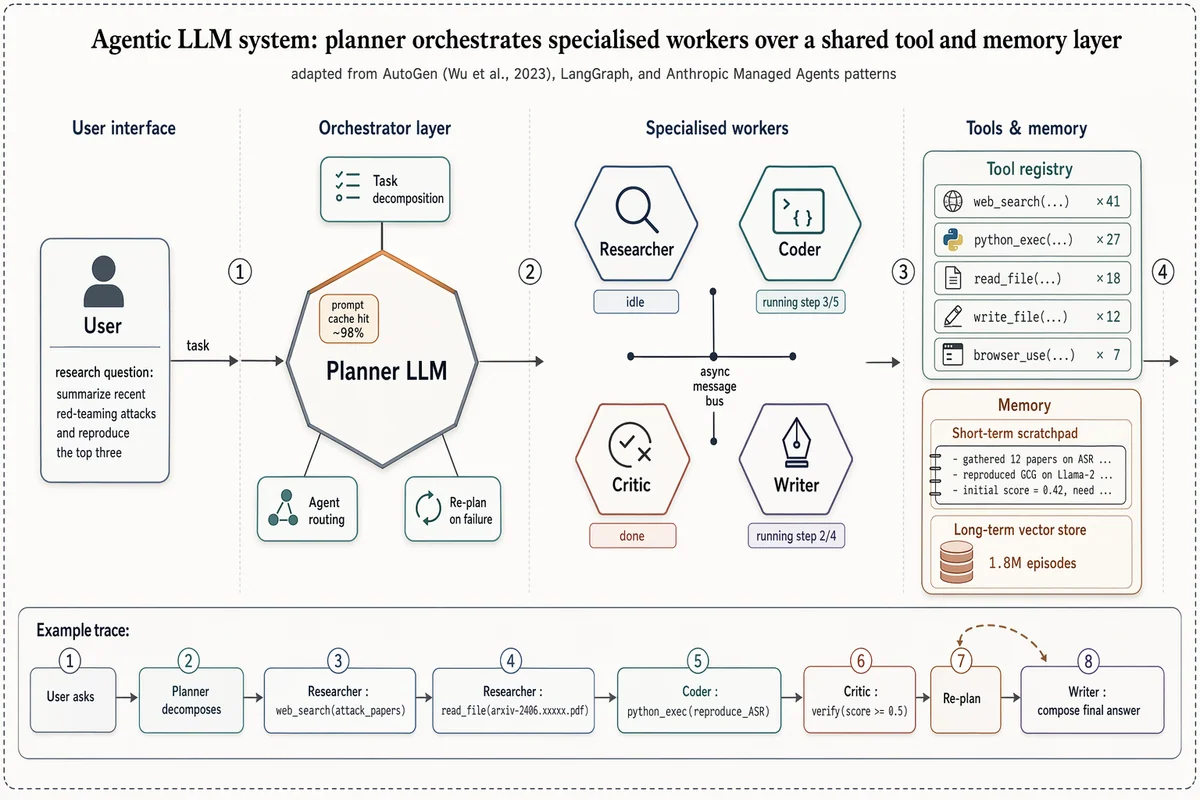
Pipeline de Retrieval-Augmented Generation
Landscape 16:9 academic systems diagram of a RAG pipeline, 6-stage left-to-right flow. (1) "User query" box with placeholder text "What are the side effects of drug X?" and a small user silhouette. (2) Hexagonal "Embedding encoder (BERT-style)", caption "dense vector d=768". (3) Stylised database cylinder "Vector store" with "Index: 1.2M chunks"; arrow from (2) labeled "kNN, k=5". (4) "Retrieved passages" — stack of 5 doc thumbnails; caption "top-k chunks + metadata". (5) Hexagonal hub "Frozen LLM"; long curved arrow from (1) labeled "original query" also lands here; arrow from (4) labeled "retrieved context". (6) "Grounded answer" with inline marker "[cite: doc#47]"; caption "with source citations". Dashed outline around (2)-(3) labeled "OFFLINE — built once". Dashed outline around (4)-(5) labeled "ONLINE — per query". Title: "Retrieval-Augmented Generation pipeline". Subtitle: "Lewis et al., 2020".
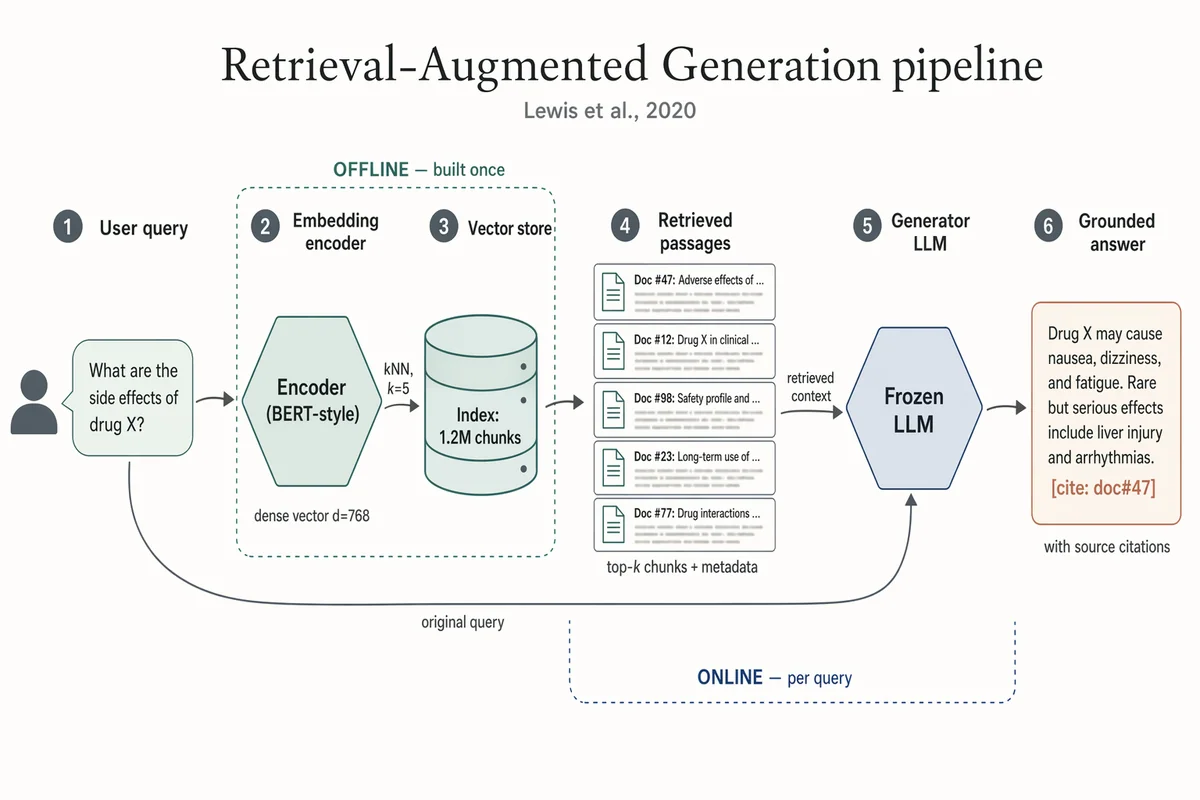
Arquitectura encoder–decoder de Transformer
Landscape 16:9 academic concept figure of the Transformer encoder-decoder architecture, NeurIPS camera-ready style. Two vertical column stacks side-by-side with a dashed divider. LEFT column header: "ENCODER (×N)". Blocks bottom-to-top: "Input tokens" → "Input Embedding" → "+ Positional Encoding" → dashed "Encoder layer" containing "Multi-Head Self-Attention", "Add & Norm", "Feed-Forward", "Add & Norm", with thin curved residual arrows around each sublayer. RIGHT column header: "DECODER (×N)". Blocks bottom-to-top: "Output tokens (shifted right)" → "Output Embedding" → "+ Positional Encoding" → dashed "Decoder layer" containing "Masked Multi-Head Self-Attention", "Add & Norm", "Multi-Head Cross-Attention" (horizontal arrow from encoder top labeled "keys, values"), "Add & Norm", "Feed-Forward", "Add & Norm". Above decoder: "Linear", "Softmax", "Output probabilities". Title: "Transformer: encoder–decoder with multi-head attention". Subtitle: "Vaswani et al., 2017".
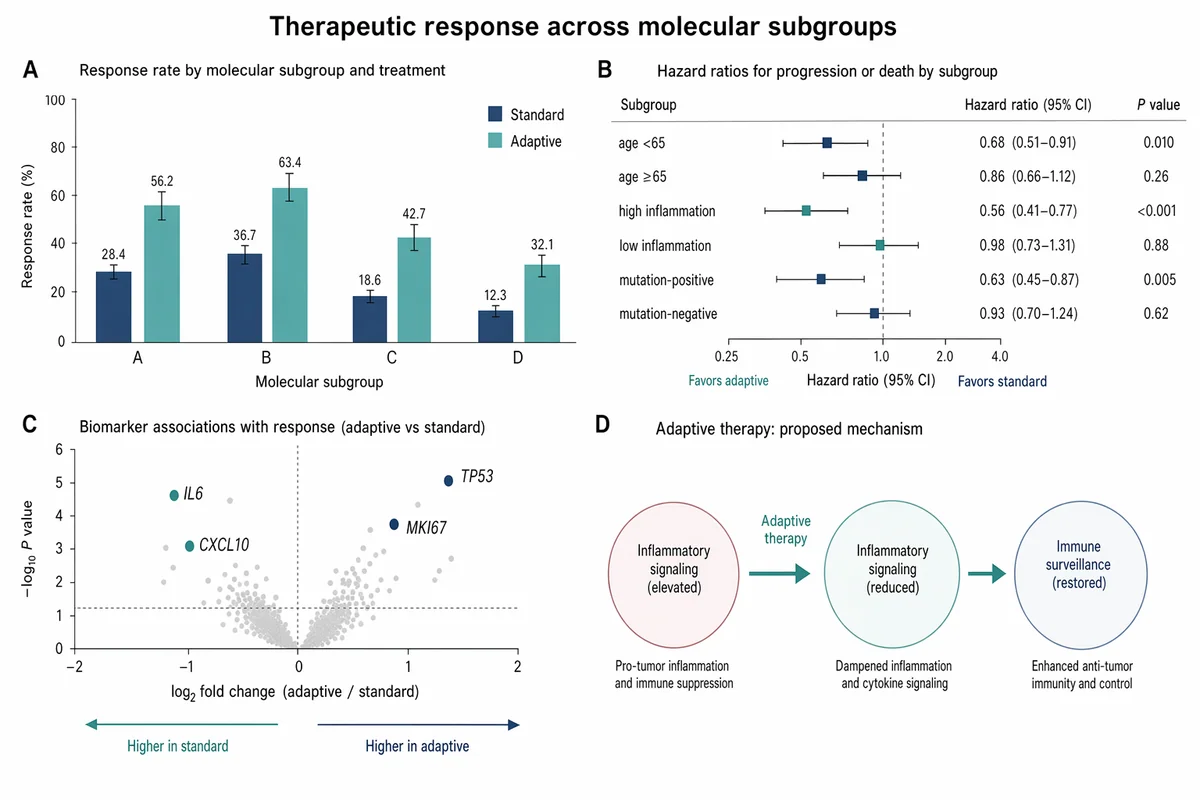
Gráfico de barras y forest plot de respuesta terapéutica
Create a Nature Medicine style statistical results figure, landscape 3:2 (1536×1024), soft, restrained, publication-quality. Figure title: "Therapeutic response across molecular subgroups". Layout: 4-panel figure labeled A–D. A. Grouped bar chart: response rate (%) for four subgroups "A", "B", "C", "D" across two treatments "standard" and "adaptive". Use muted navy and soft teal bars, thin error bars, numeric labels. B. Forest plot of hazard ratios for subgroups with a vertical reference line at HR=1.0; rows "age <65", "age ≥65", "high inflammation", "low inflammation", "mutation-positive", "mutation-negative". Use small squares and confidence intervals. C. Volcano-style biomarker association plot with pale gray background points and highlighted labeled markers "IL6", "CXCL10", "TP53", "MKI67". D. Minimal mechanism schematic: adaptive therapy reduces inflammatory signaling and restores immune surveillance; use three clean nodes connected by arrows, no complex biology drawings. Style requirements: literature-science aesthetic, white background, soft desaturated colors, thin gray axes, clear legends, compact labels, generous margins, Nature-style figure polish, no fake values that look too random, no decorative background, no watermark.
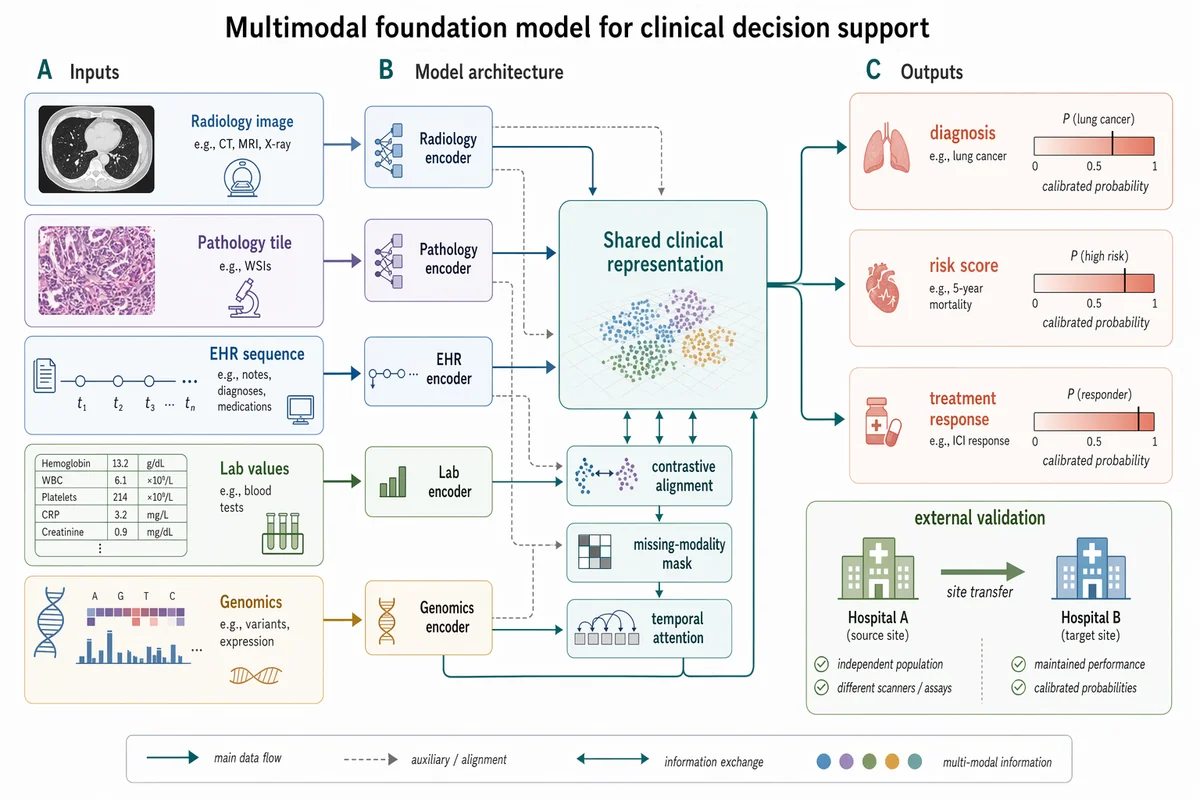
Figura de método de IA médica multimodal
Create a Nature Biomedical Engineering / NeurIPS medical-AI method figure, landscape 3:2 (1536×1024), soft literature-science colors and minimal academic layout. Figure title: "Multimodal foundation model for clinical decision support". Layout: a left-to-right method pipeline with three horizontal bands and panel labels A–C. A. Inputs on the left: small clean icons and labeled cards "Radiology image", "Pathology tile", "EHR sequence", "Lab values", "Genomics". Use subtle rounded rectangles. B. Middle architecture: five modality encoders feeding into a central pale-teal block "Shared clinical representation"; include small modules "contrastive alignment", "missing-modality mask", "temporal attention". Add thin arrows and skip connections. C. Outputs on the right: three task heads "diagnosis", "risk score", "treatment response" with small calibrated probability bars. Add a lower inset "external validation" showing two hospital icons and an arrow labeled "site transfer". Style requirements: soft Nature/Science palette (muted teal, dusty blue, sage green, warm sand, coral accents), white background, precise vector-like arrows, modest shadows only, readable labels, lots of whitespace, no futuristic HUD, no clinical gore, no real hospital logos, no watermark.
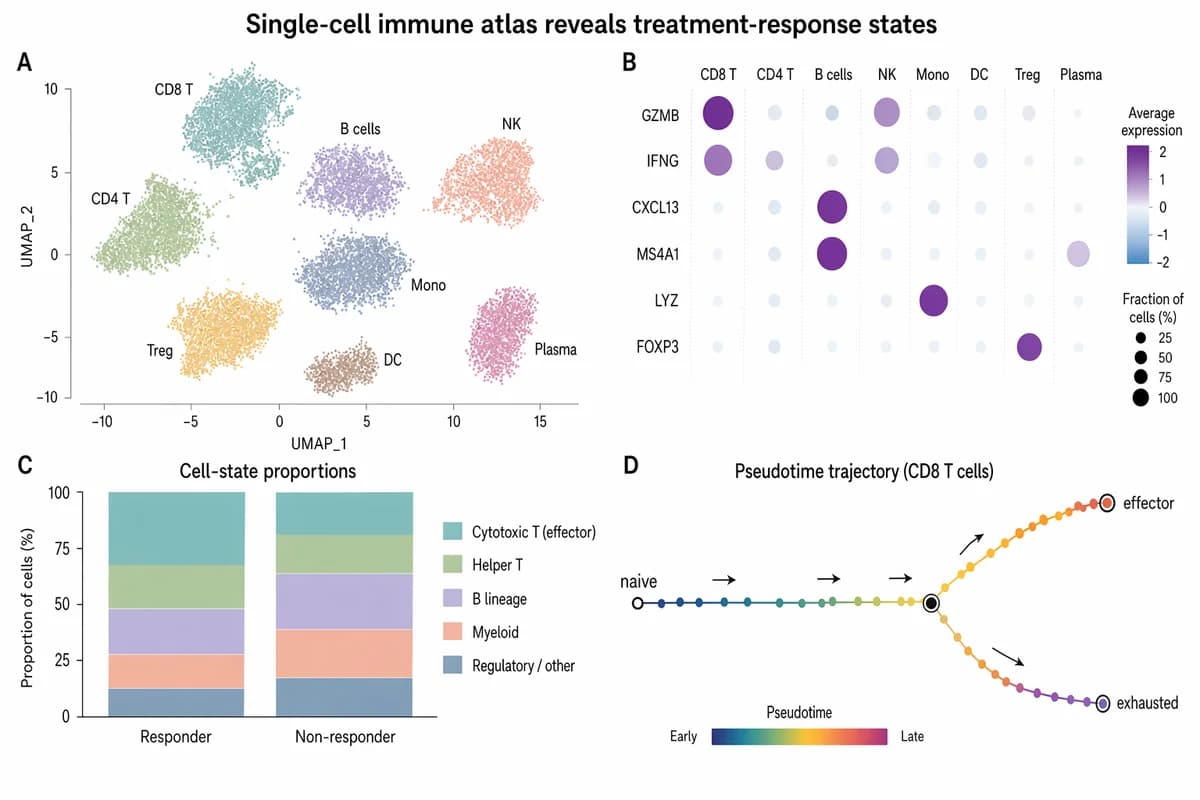
Atlas inmune de célula única revela estados de respuesta al tratamiento
Create a polished Nature / Cell style biomedical research figure, landscape 3:2 (1536×1024), soft minimal palette, publication-ready. Figure title: "Single-cell immune atlas reveals treatment-response states". Layout: 4-panel figure labeled A–D. A. Large UMAP scatter plot with 8 softly colored immune clusters; labels: "CD8 T", "CD4 T", "B cells", "NK", "Mono", "DC", "Treg", "Plasma". Use pastel teal, sage, lavender, peach, slate, amber. B. Dot plot of marker genes with rows "GZMB", "IFNG", "CXCL13", "MS4A1", "LYZ", "FOXP3" and columns matching immune clusters; dot size = fraction, color = expression. C. Small stacked bar chart comparing "Responder" vs "Non-responder" cell-state proportions, with 5 muted segments and a tidy legend. D. Pseudotime trajectory diagram: a clean branching curve from "naive" to "effector" and "exhausted", with small arrows and gradient color. Style requirements: literature-science design, white background, thin gray axes, compact legends, readable micro-labels, restrained typography, soft colors, elegant spacing, no 3D, no glossy UI, no fake journal logo, no watermark.